Reporting Beyond Impressions & Clicks
Every campaign includes a real-time dashboard with engagement heatmaps, per-overlay click data, and full CSV export — no cookies required.
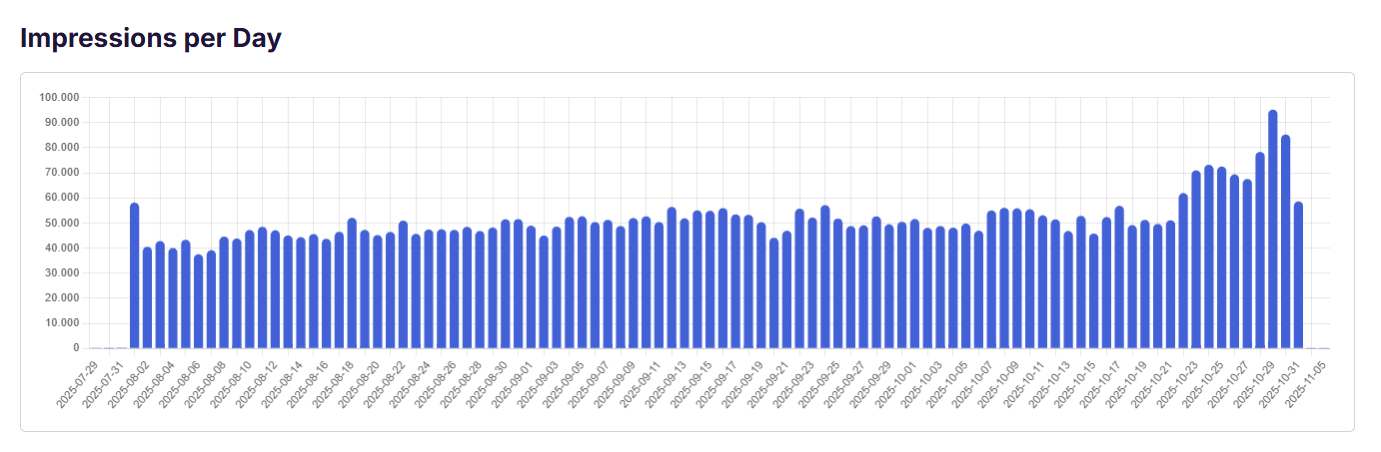
Impression Overview Across Your Campaigns
Track impressions across your entire campaign or per individual creative. See exactly how delivery unfolds over time — day by day.
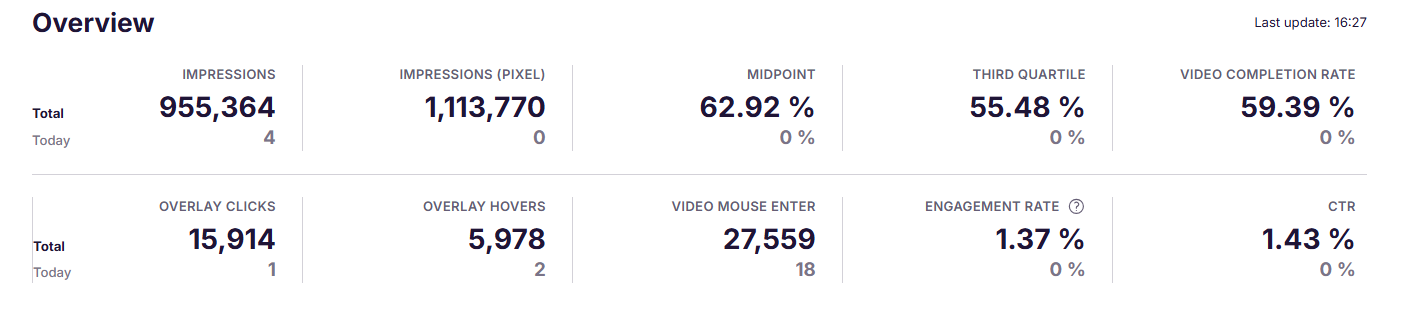
From Impressions to Overlay Clicks — Every Data Point
From basic delivery to deep engagement insights — track the data points that prove your interactive campaigns work.
Impressions
Total ad impressions and pixel-verified impressions — across the full campaign or per creative.
Video Completion Rate
See what percentage of viewers watched the entire video, plus midpoint and third quartile data.
Engagement Rate
Percentage of viewers who actively interacted with any overlay — the metric that proves interactive ads work.
Overlay Clicks & Hovers
Every click and hover on any overlay element — broken down per overlay with target URLs and time ranges.
CTR
Click-through rate across the entire campaign — see which creatives and overlays drive the most traffic.
Average Watch Time
Know exactly how long viewers stay engaged with your video content on average.
Heatmaps, Per-Overlay Breakdowns, and Granular Event Data
Beyond the overview metrics, dive into heatmaps, per-overlay breakdowns, and granular event data to truly understand how your audience engages.
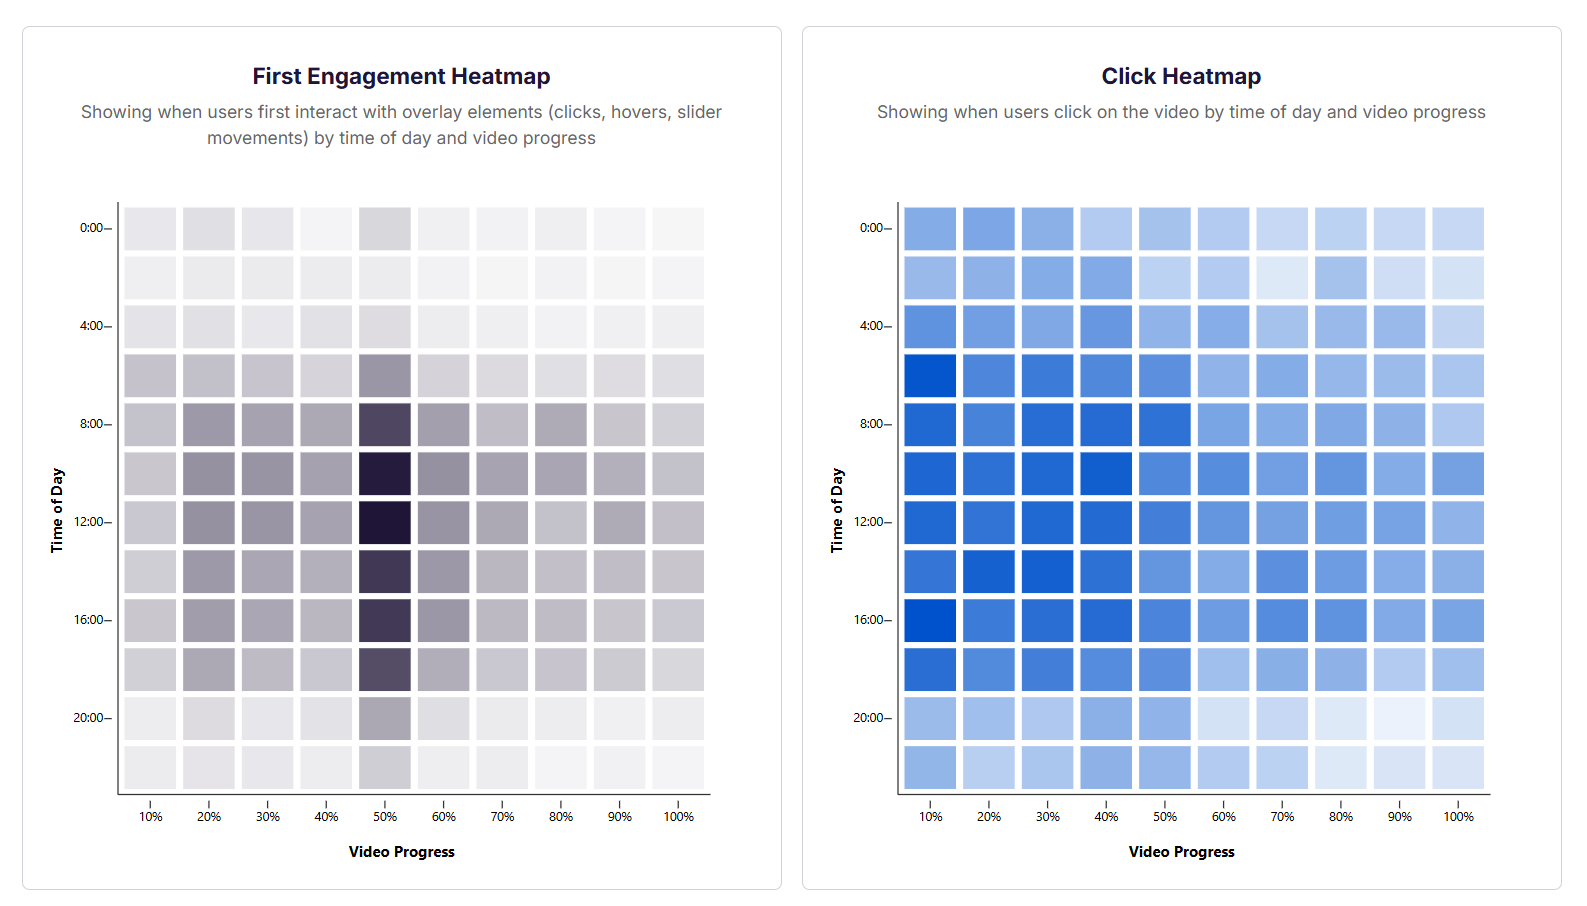
See When & Where Viewers Engage
Two side-by-side heatmaps reveal engagement patterns you can't get from standard metrics. See when users first interact with overlays and when they click — mapped by time of day and video progress. Identify the moments that drive the most engagement.
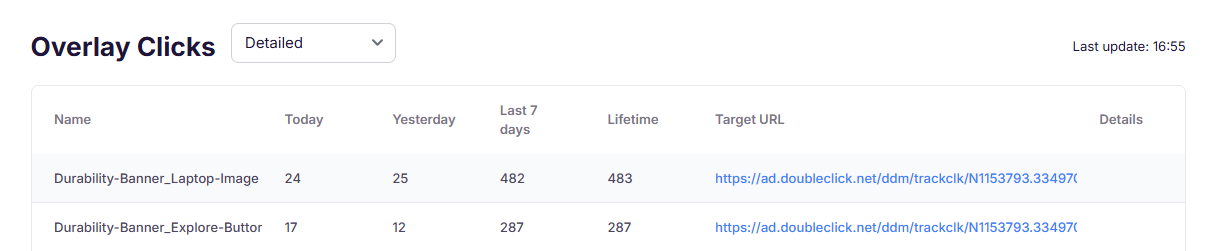
Every Overlay, Every Click
See detailed click data for each individual overlay element — today, yesterday, last 7 days, and lifetime. Know which overlays perform best and where each click leads with full target URL tracking.
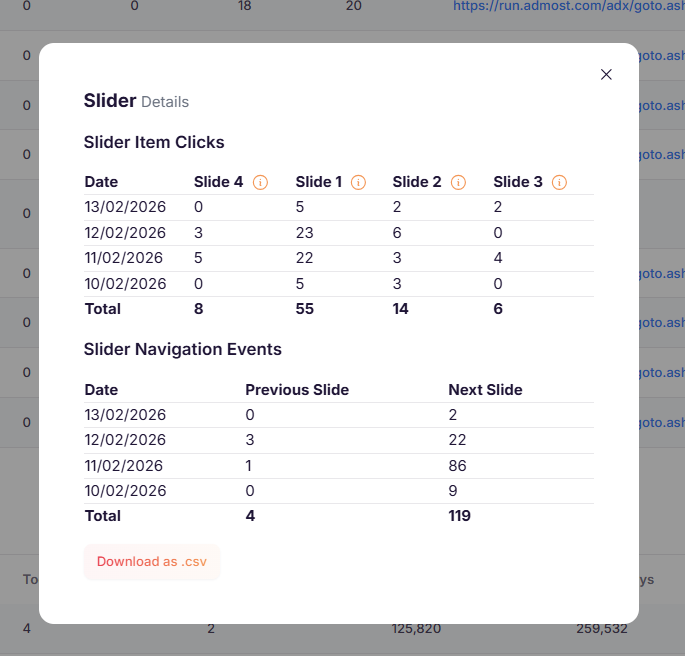
Granular Data for Every Overlay Type
Each overlay type comes with its own detailed reporting. For sliders, see per-slide click data and navigation events. For surveys, see response distributions. Understand not just that someone interacted, but how they interacted.
Built for Publishers and Agencies
Whether you're a publisher proving ROI to clients or an advertiser tracking campaign performance — our reporting speaks your language.
Prove the value of interactive ads
- Prove campaign ROI to your advertising clients with concrete data
- Share professional reports that build long-term trust
- Export data as CSV for seamless integration into your workflow
- Demonstrate the added value of interactive ads over standard formats
Full transparency on performance
- Know exactly how your ad budget translates into engagement
- Compare engagement metrics against industry benchmarks
- Detailed click-through data for every overlay and CTA
- Cookieless tracking that respects your audience's privacy
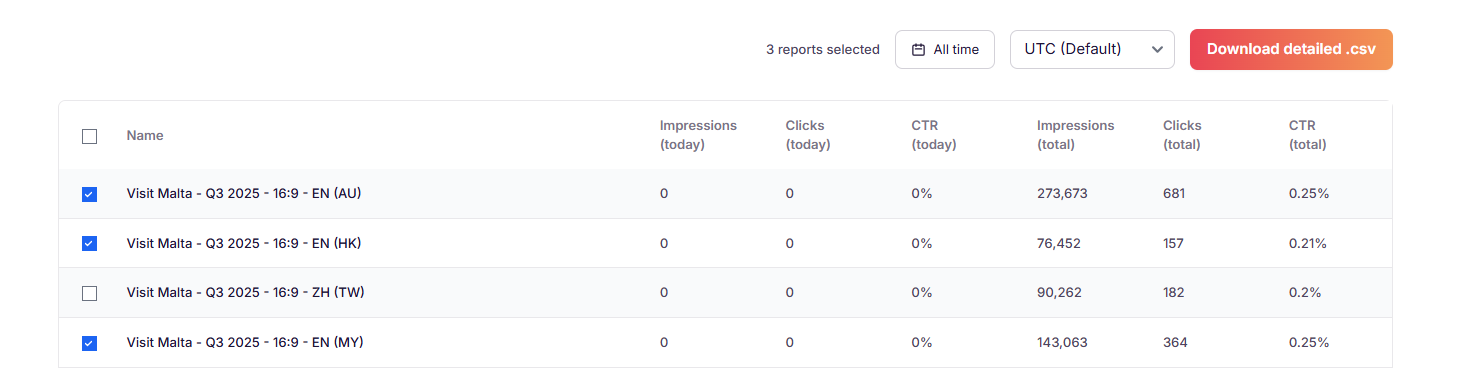
Built for Your Workflow
Select one or multiple campaigns, choose your preferred timezone, and download a detailed CSV with one click. Integrate it into your existing tools, build custom client presentations, or import it into your BI system.

Whitelabel Public Reporting
Give your clients their own branded reporting link. They can check live campaign results anytime — on a page that looks and feels entirely like your brand.
- Your domain, your brand Custom colors, logo, and typography — no Clipflip branding visible
- Shareable link One link your client can bookmark — live data, no login required
- Real-time data Campaign metrics update live — no manual report generation
- Built for client trust Professional reporting pages that strengthen your client relationships
Trusted by publishers & agencies around the world
Many publishers & agencies around the world are using Clipflip to position themselves as innovation leaders & impress their clients with new technology.

Ready to See Your Campaign Data?
Start your first interactive video campaign and experience our reporting firsthand. Your first campaign is free.

Frequently Asked Questions

Clipflip tracks a comprehensive set of metrics including impressions, overlay clicks, video events (play, pause, mute, unmute, resume), completion rate, interaction rate, and click-through URLs. All metrics are available in your reporting dashboard in real-time.
Yes! All campaign data can be exported as CSV with a single click. This makes it easy to import into your existing BI tools, create custom client reports, or integrate with your overall analytics workflow.
Yes, 100%. Clipflip uses aggregate, anonymized event-based tracking that requires no cookies or personal data collection. We are a registered IAB Europe TCF 2.2 vendor and fully GDPR compliant across all EU markets.
Absolutely. You can export data as CSV to build custom presentations, or share access to the dashboard directly. For a premium experience, our whitelabel feature gives clients a branded, live reporting page on your own domain — no login required. The clear, visual format makes it easy for clients to understand campaign performance at a glance.
The Interaction Rate measures the percentage of viewers who actively interacted with any overlay element in your video. Unlike passive metrics like views or impressions, this shows genuine engagement — people clicking, exploring, and engaging with your interactive content. It's the key metric that demonstrates the added value of interactive video ads.
Reporting data is available in real-time. As soon as your campaign starts delivering impressions, you can see performance metrics updating live in your dashboard. This allows you to monitor campaigns as they run and make informed decisions quickly.